k-Means Clustering
Goal: Partition data into two or more clusters.
The idea behind k-Means Clustering is to take a bunch of data and determine if there are any natural clusters (groups of related objects) within the data.
The k-Means algorithm is a so-called unsupervised learning algorithm. We don't know in advance what patterns exist in the data -- it has no formal classification to it -- but we would like to see if we can divide the data into groups somehow.
For example, you can use k-Means to find what are the 3 most prominent colors in an image by telling it to group pixels into 3 clusters based on their color value. Or you can use it to group related news articles together, without deciding beforehand what categories to use. The algorithm will automatically figure out what the best groups are.
The "k" in k-Means is a number. The algorithm assumes that there are k centers within the data that the various data elements are scattered around. The data that is closest to these so-called centroids become classified or grouped together.
k-Means doesn't tell you what the classifier is for each particular data group. After dividing news articles into groups, it doesn't say that group 1 is about science, group 2 is about celebrities, group 3 is about the upcoming election, etc. You only know that related news stories are now together, but not necessarily what that relationship signifies. k-Means only assists in trying to find what clusters potentially exist.
The algorithm
The k-Means algorithm is really quite simple at its core.
First, we choose k random data points to be the initial centroids. Then, we repeat the following two steps until we've found our clusters:
- For each data point, find which centroid it is closest to. We assign each point to its nearest centroid.
- Update the centroid to the mean (i.e. the average) of its nearest data points. We move the centroid so that it really sits in the center of the cluster.
We need to repeat this multiple times because moving the centroid changes which data points belong to it. This goes back and forth for a bit until everything stabilizes. That's when we reach "convergence", i.e. when the centroids no longer move around.
A few of the parameters that are required for k-Means:
- k: This is the number of centroids to attempt to locate. If you want to group news articles, this is the number of groups to look for.
- convergence distance: If all the centroids move less than this distance after a particular update step, we're done.
- distance function: This calculates how far data points are from the centroids, to find which centroid they are closest to. There are a number of distance functions that can be used, but most commonly the Euclidean distance function is adequate (you know, Pythagoras). But often that can lead to convergence not being reached in higher dimensionally.
Let's look at an example.
Good clusters
This first example shows k-Means finding all three clusters. In all these examples the circles represent the data points and the stars represent the centroids.
In the first iteration, we choose three data points at random and put our centroids on top of them. Then in each subsequent iteration, we figure out which data points are closest to these centroids, and move the centroids to the average position of those data points. This repeats until we reach equilibrium and the centroids stop moving.
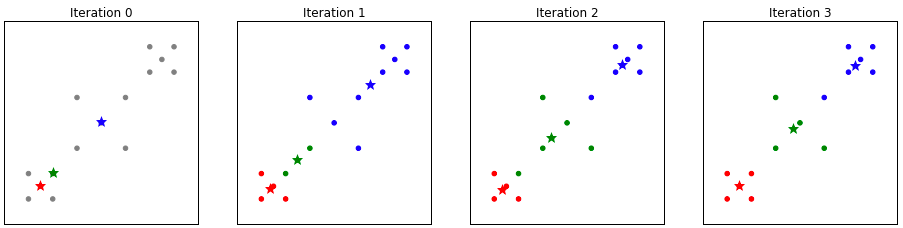
The selection of initial centroids was fortuitous! We found the lower left cluster (indicated by red) and did pretty good on the center and upper left clusters.
Note: These examples are contrived to show the exact nature of k-Means and finding clusters. The clusters in these examples are very easily identified by human eyes: we see there is one in the lower left corner, one in the upper right corner, and maybe one in the middle. In practice, however, data may have many dimensions and may be impossible to visualize. In such cases, k-Means is much better at this job than human eyes!
Bad clustering
The next two examples highlight the unpredictability of k-Means and how it does not always find the best clustering.
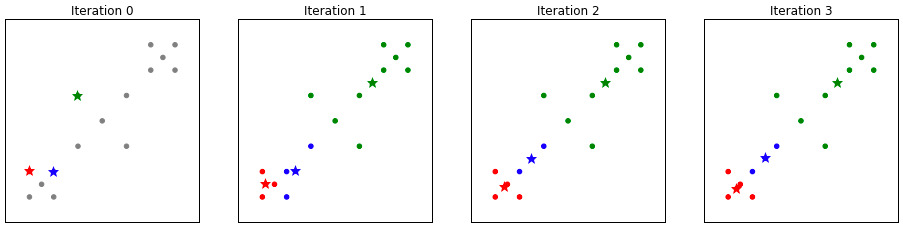
As you can see in this example, the initial centroids were all a little too close to one another, and the blue one didn't quite get to a good place. By adjusting the convergence distance we should be able to improve the fit of our centroids to the data.
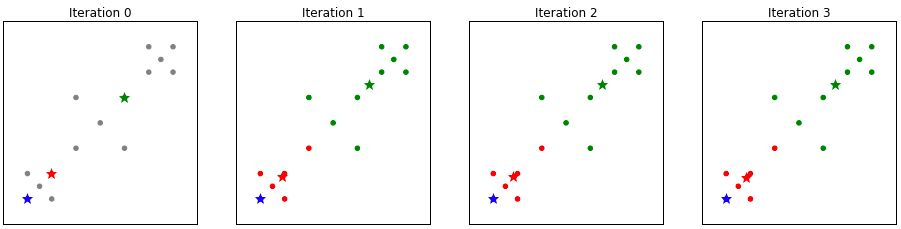
In this example, the blue cluster never really could separate from the red cluster and as such sort of got stuck down there.
Improving bad clustering
In these examples of "bad" clustering, the algorithm got stuck in a local optimum. It does find clusters but they're not the best way to divide up the data. To increase your chances of success, you can run the algorithm several times, each time with different points as the initial centroids. You choose the clustering that gives the best results.
To calculate how "good" the clustering is, you find the distance of each data point to its cluster, and add up all these distances. The lower this number, the better! That means each cluster is really in the center of a group of data points, and all clusters are roughly the same size and are spaced evenly apart.
The code
This is what the algorithm could look like in Swift. The points array contains the input data as Vector objects. The output is an array of Vector objects representing the clusters that were found.
func kMeans(numCenters: Int, convergeDistance: Double, points: [Vector]) -> [Vector] {

  // Randomly take k objects from the input data to make the initial centroids.
  var centers = reservoirSample(points, k: numCenters)

  // This loop repeats until we've reached convergence, i.e. when the centroids
  // have moved less than convergeDistance since the last iteration.
  var centerMoveDist = 0.0
  repeat {
    // In each iteration of the loop, we move the centroids to a new position.
    // The newCenters array contains those new positions.
    let zeros = [Double](count: points[0].length, repeatedValue: 0)
    var newCenters = [Vector](count: numCenters, repeatedValue: Vector(zeros))

    // We keep track of how many data points belong to each centroid, so we
    // can calculate the average later.
    var counts = [Double](count: numCenters, repeatedValue: 0)

    // For each data point, find the centroid that it is closest to. We also
    // add up the data points that belong to that centroid, in order to compute
    // that average.
    for p in points {
      let c = indexOfNearestCenter(p, centers: centers)
      newCenters[c] += p
      counts[c] += 1
    }

    // Take the average of all the data points that belong to each centroid.
    // This moves the centroid to a new position.
    for idx in 0..<numCenters {
      newCenters[idx] /= counts[idx]
    }

    // Find out how far each centroid moved since the last iteration. If it's
    // only a small distance, then we're done.
    centerMoveDist = 0.0
    for idx in 0..<numCenters {
      centerMoveDist += centers[idx].distanceTo(newCenters[idx])
    }

    centers = newCenters
  } while centerMoveDist > convergeDistance

  return centers
}
Note: The code in KMeans.swift is slightly more advanced than the above listing. It also assigns labels to the clusters and has a few other tricks up its sleeve. Check it out!
Performance
k-Means is classified as an NP-Hard type of problem. That means it's almost impossible to find the optimal solution. The selection of the initial centroids has a big effect on how the resulting clusters may end up. Finding an exact solution is not likely -- even in 2 dimensional space.
As seen from the steps above the complexity really isn't that bad -- it is often considered to be on the order of O(kndi), where k is the number of centroids, n is the number of d-dimensional vectors, and i is the number of iterations for convergence.
The amount of data has a linear effect on the running time of k-Means, but tuning how far you want the centroids to converge can have a big impact how many iterations will be done. As a general rule, k should be relatively small compared to the number of vectors.
Often times as more data is added certain points may lie in the boundary between two centroids and as such those centroids would continue to bounce back and forth and the convergence distance would need to be tuned to prevent that.
See Also
K-Means Clustering on Wikipedia
Written by John Gill and Matthijs Hollemans